
Page 122 - New Trends in Green Construction
P. 122
Energy Sources and Renewable Energy
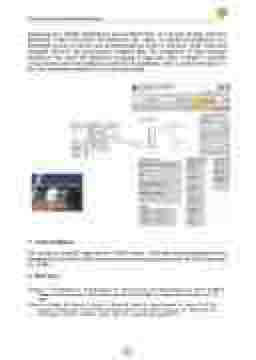
monitoring tool displays instantaneous and calculated data in real time through interactive dashboards. Figure 2(b) shows the production tab, where the production parameters of a determinate inverter are shown, such as energy produced, yields or efficiency. These output data calculated based on the pyranometers irradiance data. The arrangement of these measures, therefore, is very useful for installations occupying a large area, where it might be advisable to have several records of irradiance recorded by the installation, either to compare the data or to have this information available if one of the sensors fails
3. Acknowledgment
This research is partially supported by CLARA Project, which has received funding from the European Union's Horizon 2020 research and innov ation programme under the Grant Agreement No 730482.
4. References
Santiago, I.; Trillo Montero, D.; Luna Rodríguez, J.J.; Moreno Garcia, I.M.; PalaciosGarcia, E.J. (2017), Graphical Diagnosis of Performances in Photovoltaic Systems: A Case Study in Southern Spain, Energies 2017, 10, 1964.
Woyte, A.; Ritcher, M.; Moser, D.; Reich, N.; Green, M.; Mau, S.; Garrad Hassan, G.; Beyer, H. (2014),
Analytical Monitoring of Grid-Connected Photovoltaic Systems. Good Practices for Monitoring and Performance Analysis. Available online: http://iea- pvps.org/index.php?id=276
122
