
Page 166 - New Trends in Green Construction
P. 166
Clean Environment
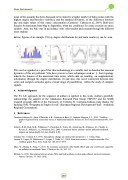
mean of this quantity has been discussed to be related to a higher number of hubs (nodes with the highest degree and therefore visibility), and the standard deviation, to the difference between day and night values of this ozone concentration (Carmona- Cabezas et al., 2019). Both were found to be maximum from May to September, when the conditions for ozone creation are more suitable. Also, the P(k) was in accordance with other studies and constant through the different years studied.
Below, figures of an example VG (a), degree distributions (b) and main results (c) can be seen.
This can be regarded as a proof that this methodology is a suitable tool to describe the seasonal dynamics of this air pollutant. VGs have proven to have advantages such as: i) their topology inherits the features of the associated time series, which ends up resulting on supplementary information through the degree distribution; ii) and also, this novel connection between time series and complex networks opens a broad range of possibilities within the study of complex signals.
4. Acknowledgment
The F L A E approach for the sequence of authors is applied in this work. Authors gratefully acknowledge the support of the Andalusian Research Plan Group TEP-957 and the XXIII research program (2018) of the University of Cordoba. R. Carmona-Cabezas truly thanks the backing of the “Programa de Empleo Joven” (European Regional Development Fund / Andalusia Regional Government).
5. References
Carmona-Cabezas,R.,Ariza-Villaverde,A.B.,GutiérrezdeRavé,E.,Jiménez-Hornero,F.J., 2019.Visibility graphs of ground-level ozone time series: A multifractal analysis. Science of The Total Environment 661, 138– 147.
Doherty,R.M.,Heal,M.R.,Wilkinson,P.,Pattenden,S.,Vieno,M.,Armstrong,B.,Atkinson, R.,Chalabi,Z., Kovats, S., Milojevic, A., Stevenson, D.S., 2009. Current and future climate- and air pollution-mediated impacts on human health. Environ. Health. 8, S8.
Graedel, T.E., Crutzen, P.J., 1993. Atmospheric change: an earth system perspective. J. Chem. Educ. Lacasa,L.,Luque,B.,Ballesteros,F.,Luque,J.,Nuño,J.C.,2008.Fromtimeseriesto complexnetworks:The
visibility graph. Proc. Natl. Acad. Sci. 105, 4972–4975.
Miao, W., Huang, X., Song, Y., 2017. An economic assessment of the health effects and crop yield losses caused by air pollution in mainland China. J. Environ. Sci. 56, 102–113.
Sillman,S.,1999.Therelationbetweenozone,NOxandhydrocarbonsinurbanandpolluted ruralenvironments. Atmos. Environ. 33, 1821–1845.
166
