
Page 95 - New Trends in Green Construction
P. 95
New Trends in Green Construction
QUANTIFICATION OF NATURAL LIGHT USE IN FACADES
José Ramírez-Faz, Javier Gómez-Uceda, Rafael López-Luque
Keywords: solar access in urban fabric; Solar Vision Factor 1. Introduction
The incidence of natural light inside living spaces has a high impact on the health and psychological comfort of people and it also contributes to improving the indoor climate, at the same time it reduces the energy demand of the building (Márquez-García, 2013). Thus, the energy audit of buildings will require an in-depth analysis that allows each piece of the building to be known (Márquez-García). In the constructive phase, the knowledge of the degree of window exposure can determine the final design of the building (Gómez Muñoz, 2003). In addition, it allows us to choose the materials conforming the window, (transparent polymer, glass sheets and translucent polymer...) (Smith, 2004). This design method is increasingly needed in geographic areas where buildings require heating. In this sense, the Building Performance Simulation (BPS) tools compare from a theoretical point of view different models related to energy use and efficiency in buildings, providing quick and useful information to technicians [4]. However, in urban settings, this analysis can be complex, due to several existing interactions, including those with neighboring buildings or the effect of trees [7] and the fact that each neighbourhood must be studied independently [8].
2. Materials and methods
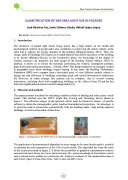
This paper presents a method for evaluating variables related to shading and solar access inside rooms. This method uses the LRTV (Light Ray Tracing and Visioning) device shown in figure 1. The reflection images of the spherical mirror must be treated by means of specific software to obtain the stereographic, polar, Lambert hemispherical projections. Its advantage is to avoid the need to characterize geometrically both the building under study and the adjacent buildings, as well as all possible obstructions.
Figure 1. Arrangement of the LRTV device to take the photograph to characterize a vertical hole.
The application of an astronomical algorithm for every image in the same facade made it possible to represent the solar trajectories on the 15th of each month. This algorithm has been the basis of the results presented in figure 2. It shows the possibility of graphical representation incidence moments (red lines) during day hours (white sections). The precise knowledge of the instants in which solar incidence occurs enables us to determine the incidence schedules for the representative days of eachmonth.Figure2showsthesetimes, bothinsolarandGMT+1time.
95
