
Page 96 - New Trends in Green Construction
P. 96
Energy Efficient Building
Figure 2. Graphical representation of light hours received in a window
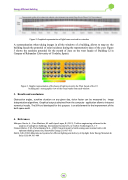
A systematization when taking images in all the windows of a building, allows to map on the building facade the potential of solar incidence during the representative days of the year. Figure 3 shows the sunshine potential for the month of June on the west facade of Building C2 in Campus of Rabanales (University of Cordoba, Spain).
Figure 3. Graphic representation of the hours of light received in the West facade of the C2 building and stereographic view of the visual vaults from each window.
3. Results and conclusions
Obstruction angles, sunshine duration on any given day, vision factor can be measured by image interpretationalgorithms.Graphicaloutputsobtainedfromthecomputer applicationallowtointerpret numerical results. The SKY tool developed for this purpose is an aid element for the improvement of the built-space audit.
4. References
Márquez-García, A., Varo-Martínez, M. and López-Luque, R. (2013), Toolbox engineering software for the analysis of sunlight on buildings, International Journal of Low-Carbon Technologies 0, 1–5
Gómez-Muñoz, V.M., Porta-Gándara M.A., (2003) General model to build awnings and external walls with optimum shading interaction, Renewable Energy 29, 605–613
Smith, G.B. (2004) Materials and systems for efficient lighting and delivery of daylight, Solar Energy Materials & Solar Cells 84 395–409
96
